

CARDIX | ANONYMIZED CASE STUDY
See how the same drug question changes across virtual cell families.
Give development teams a broader cellular comparison before deciding which concentration-dependent effects need further investigation.
THE SCIENTIFIC QUESTION
CardiX examined the same concentration-dependent hERG effect across three tailored virtual-myocyte families. Comparing action-potential duration and candidate early afterdepolarizations helped the client see how baseline cellular context influenced the modeled response.
- The challenge
- One hERG profile, different cellular contexts
- The intervention
- Concentration-dependent modeling across three virtual families
- The outcome
- A structured comparison to focus follow-up questions
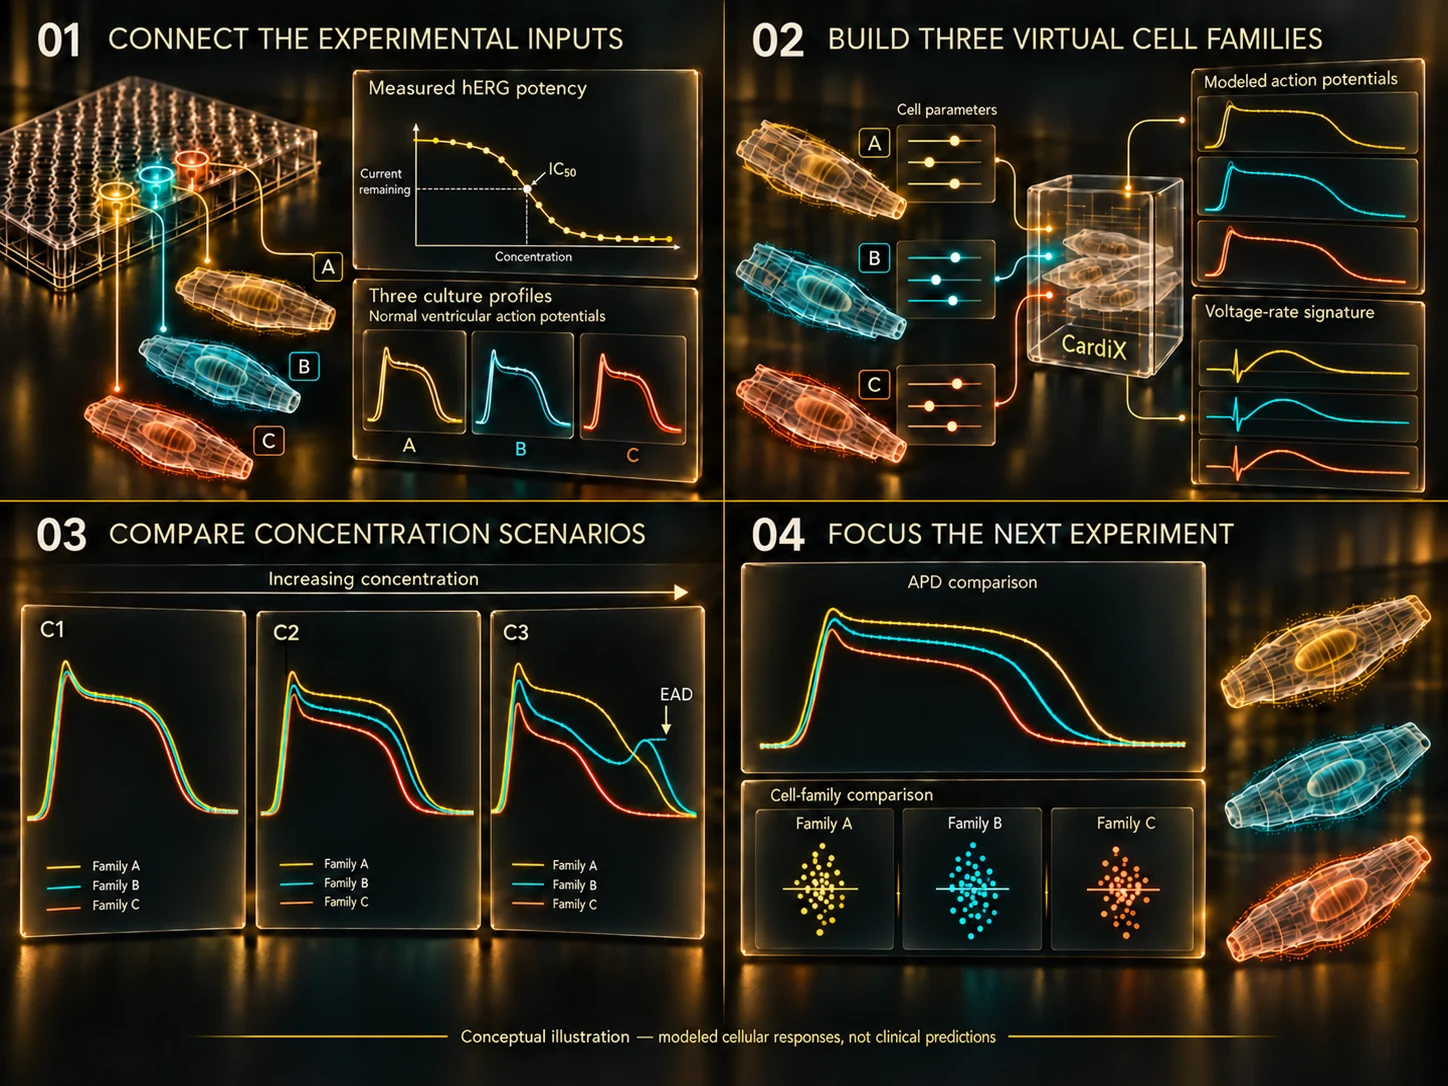
01 / DEFINE THE DRUG INPUT
Connect hERG potency to the concentration question.
The client brought hERG potency information, including IC50, and a set of concentrations to examine. IC50 describes the concentration associated with half-maximal inhibition under the underlying assay conditions. CardiX used this evidence to define the concentration-dependent drug effect applied in the study.
The same pharmacological input could then be examined in different cellular settings. This separated the question of drug potency from the question of how a cell responds to that intervention.
02 / BUILD THE CELLULAR COMPARISON
Give each virtual family a defined starting point.
Three tailored virtual-myocyte families represented distinct baseline electrophysiological profiles. Each family had its own baseline definition, established separately from the compound’s hERG input.
These profiles provided the cellular context for the comparison. Following the same drug effect across all three families made differences in the modeled action-potential response easier to relate to concentration and baseline behavior.
03 / EXAMINE REPOLARIZATION
Compare duration and emerging waveform features.
At each selected concentration, the analysis examined action-potential duration (APD) and candidate early afterdepolarizations (EADs). APD measures the duration from depolarization to a defined degree of repolarization; changes in duration help characterize how the waveform responds to the intervention.
An EAD is a secondary depolarization that occurs during repolarization, before the cell has fully returned to its resting state. Comparing its occurrence and expression alongside APD gave the client a richer view of the modeled response than a single duration measure.
04 / FOCUS THE FOLLOW-UP
Identify the cellular questions that deserve the next test.
The client received a structured comparison across the selected concentrations and three virtual-cell families. The combined view of APD and candidate EAD behavior helped identify the conditions and waveform features that warranted closer investigation.
This organized the next study around specific questions: which concentration-dependent changes should be checked, which baseline characteristics matter, and what further cellular evidence would help resolve the interpretation.
WHAT THIS ENABLED
A clearer comparison of concentration and cellular context.
The three-family assessment connected hERG potency with modeled APD and candidate EAD behavior, giving the client a focused basis for planning the next cellular investigation.
CardiX uses proprietary ADETERA mathematical models and scientific methods. Detailed formulations and implementation methods are not disclosed.
INTERPRETING THIS CASE
The findings depend on the channel input and baseline-family definitions. Cellular APD and EAD features support mechanistic investigation; they do not directly establish ECG QT changes or clinical risk.