Protect assay investment
Revisit difficult or historical readouts and identify which evidence merits further investigation before committing to repeat work.


PLATEX | MICROPLATE ANALYTICS, AUTOMATION & SIGNAL RESCUE
Protect the value of your assay work and focus the next round of experiments. PlateX connects plate mapping, data collection and analytics in a scientific system tailored to your screening question.
Microplate and plate-reader data analysis for high-throughput screening (HTS), kinetic assays and dose-response studies, configured around the evidence your assay can provide.
THE BUSINESS CASE
For screening directors, assay-development leads and R&D teams, the cost of a difficult readout includes delayed decisions, repeated analysis and candidates left unresolved. PlateX brings the data, the analytical questions and the follow-up priorities into one tailored workflow.
Revisit difficult or historical readouts and identify which evidence merits further investigation before committing to repeat work.
Connect plate context, collection and repeatable analytics so the team can move from raw files to interpretable results with less manual reconciliation.
Give scientists and project leaders a clearer account of supported responses, unresolved cases and the confirmation work that can change a decision.
01 | FROM PLATE MAP TO RESULTS
Microplate and plate-reader data analysis starts before a curve is interpreted. A well needs to remain connected to its sample, condition, concentration, controls and replicates. When that context is scattered across reader files and separate records, even a strong response can become difficult to compare or explain.
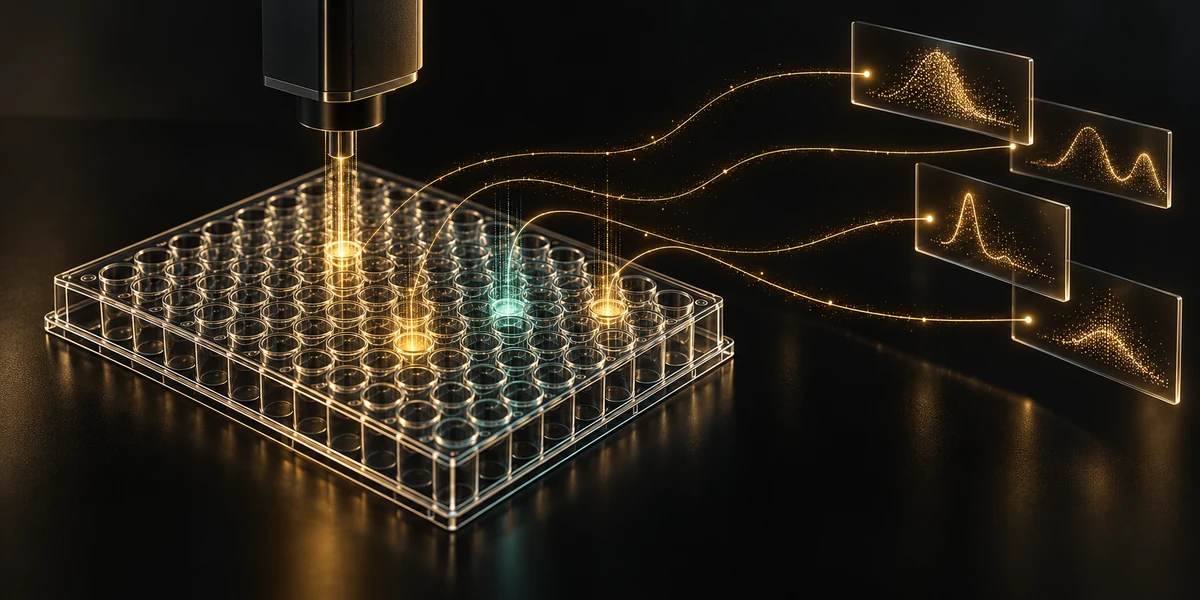
PlateX systems can be configured around plate mapping and data collection, bringing well-level context together with the corresponding readouts. The workflow can connect data import or available acquisition interfaces with processing, quality review, analytics and the results the team needs. Automation is scoped around the client’s instruments, data formats and operating environment.
The analytical view can follow a response within a well, compare related wells and examine behavior across a plate or study. It supports kinetic and dose-response questions while preserving the link between a result and the experiment that produced it.
In a high-throughput screening (HTS) workflow, a numerical readout is only the starting point. Background, control behavior and replicate agreement determine how responses can be compared. The analysis keeps the measured signal, the processing applied and the resulting interpretation distinct, so a screening lead can review why a candidate was prioritized.
What the team receives: a coherent plate-to-results workflow, consistent well-level interpretation and outputs shaped around the screening or assay-development decision.
02 | SIGNAL PROCESSING & EVENT ANALYTICS
Many assays contain baseline offsets, gradual drift or unwanted fluctuations with properties that differ from the response of interest. In these cases, carefully selected combinations of conventional filtering and statistical analysis can make the important behavior easier to assess.
An endpoint captures the response at a chosen time; a kinetic assay follows its development. Time-series analysis of kinetic readouts helps distinguish differences in response timing, amplitude and sustained behavior, supporting assay troubleshooting when repeated results disagree.
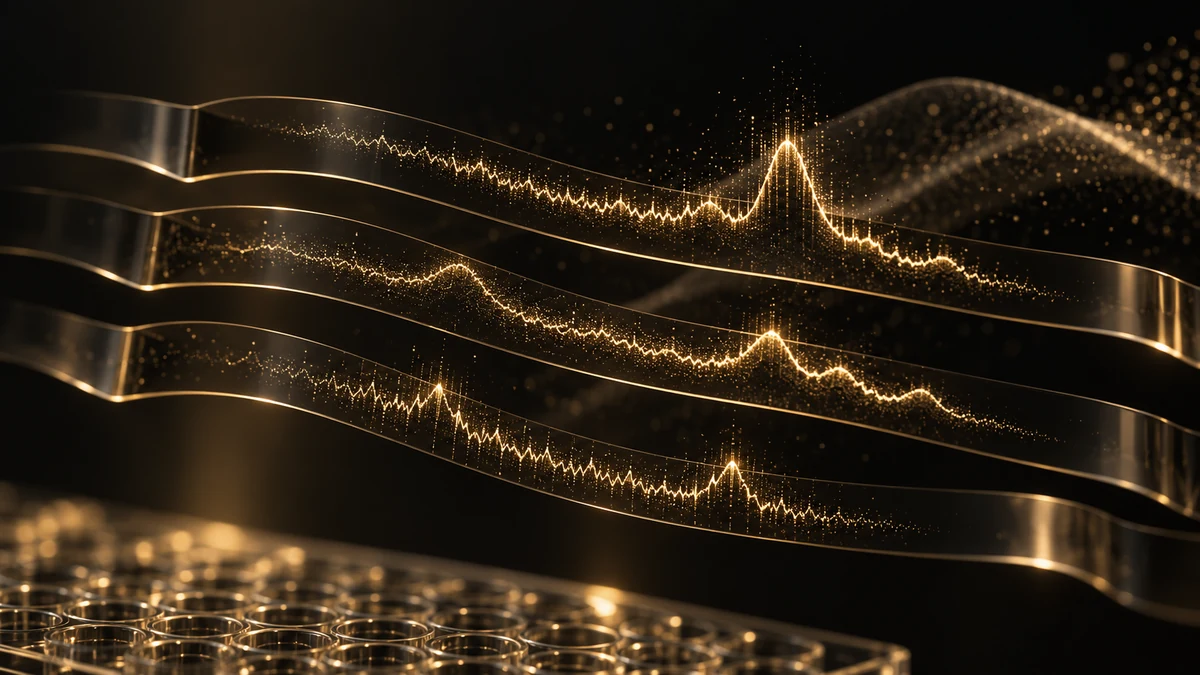
PlateX combines processing with statistical analysis of sub-signals, event and peak detection, and peak characterization. The aim is to understand the response within the relevant parts of the recording: when an event begins, how its shape develops, whether related events repeat and how the behavior compares across conditions.
A smooth-looking trace is only one possible view of the data. The interpretation also considers controls, replicate behavior and the features that matter to the assay. Processing choices must preserve those features so that a change in an event is not confused with a change introduced during analysis.
What the team receives: identified events, relevant response parameters and an interpretable account of the signal, with the review criteria configured for the assay.
An anonymized PlateX case: noise that changed with recorded intensity distorted multi-peak statistics in nominally matched wells. Adaptive correction helped establish consistent control observations and stable calibration responses. Read the assay-analysis case study

03 | EXTREMELY LOW SIGNAL-TO-NOISE
The harder case arises at an extremely low signal-to-noise ratio (SNR), when the response is weak and its properties resemble those of the noise. The response and unwanted variation may occupy similar time scales or show similar statistical behavior. Conventional processing can then leave the question unresolved or suppress part of the information being sought.
This matters especially for a uniquely informative assay: one that addresses an important biological question but produces a difficult readout. PlateX includes specialized advanced statistical denoising and signal-rescue capabilities for investigating whether meaningful response structure is present and what evidence supports that interpretation.
ADETERA has demonstrated this approach on example datasets. A client evaluation starts with representative assay data and the scientific question, then assesses signal presence and the possibility of false negatives or false positives. A weak or inconclusive readout is reviewed as an unresolved evidence question; a recovered pattern is examined against controls and confirmation data.
What the team receives: a reasoned assessment of recoverable information, unresolved cases and the subset worth experimental follow-up. The scope and conclusions depend on the assay and the evidence available.

04 | SCREENING ARCHIVES & TARGETED CONFIRMATION
A screening archive represents experimental effort, sample investment and knowledge about an assay. Some responses may have remained unresolved because the signal was difficult, the analytical workflow was limited or the original question was narrower than the one the team now needs to answer.
Retrospective screening-data reanalysis revisits recorded responses alongside their plate maps, controls and experimental context to identify questions worth renewed investigation. The review examines which records support meaningful comparison and where processing choices affected interpretation. Traceability back to the original wells and conditions keeps the follow-up question concrete.
A false negative can leave a useful response unexplored; a false positive can direct confirmation work toward an artifact. Prioritization examines both possibilities. Candidate findings are organized around the evidence needed next, including repeat measurements or appropriate confirmation assays. Cases that remain inconclusive stay visible in the assessment rather than acquiring an unsupported activity label.
What the team receives: a reasoned selection of follow-up questions and an experimental confirmation plan that makes purposeful use of existing screening work.
PRACTICAL ASSAY CONTEXT
The measurement and its analysis need to be considered together. The following assay situations illustrate the types of questions a study can investigate.
Enzyme assays that track NAD(P)H absorbance or natural fluorescence can produce small or noisy changes under some conditions. A time course can provide useful context about the response beyond a single endpoint. The analytical question is whether the observed change is supported by the controls, replicates and assay conditions.
Spatial background structure and well-to-well variation can make a weak response difficult to distinguish. Reviewing the plate map, control distribution and raw readouts helps assess whether a pattern reflects the assay response or a plate-related effect, and which findings need confirmation.
WORKING WITH YOUR TEAM
The starting point is the experimental question and the evidence already available. PlateX can support a specific difficult dataset or become a repeatable analytical capability within a broader screening workflow.
TAILORED SYSTEMS | ADETERA INTELLECTUAL PROPERTY
PlateX is delivered as a tailored scientific system. Depending on the project, it can operate as a standalone application, automate a repeatable data-analysis workflow or integrate with the client’s existing data and laboratory environment. The required interfaces, outputs and acceptance criteria are defined with the team.
The mathematical models, specialized analytical methods and implementation know-how developed by ADETERA form part of ADETERA’s proprietary intellectual property. This page describes the scientific problems, capabilities and customer outcomes; proprietary methods and implementation details are not disclosed here.
QUESTIONS ABOUT PLATEX
Start with representative raw reader exports and the corresponding plate maps: well identifiers, samples, concentrations, controls and replicates. For kinetic assays, include the time points and acquisition conditions. Absorbance or fluorescence values need their units and measurement context. ADETERA reviews those files before agreeing on import, analysis and automation requirements; instrument compatibility is assessed for the project.
An endpoint compares a response at a chosen measurement time. Kinetic analysis follows its development through time, including onset, peaks and changes in behavior. PlateX can connect these views to the assay question, controls and dose-response conditions. The useful information depends on what was recorded; a time course cannot be reconstructed from an endpoint alone.
Yes. PlateX systems can connect well-level context, collection or import, processing and results. The level of automation and integration is configured around the instruments, data interfaces and operating workflow available in the project.
No. A candidate response must still be assessed against controls, replicate consistency, assay interference and suitable confirmation measurements. PlateX helps distinguish evidence for follow-up from unresolved cases. The project defines the interpretation criteria for the assay, including how weak responses and possible false calls are reviewed.
Conventional processing is useful when baseline, drift or noise can be distinguished from the response by their properties. Advanced statistical investigation addresses harder cases where the signal is extremely weak and resembles the unwanted variation. The assay evidence determines which approach and review criteria are appropriate.
Yes. Historical data can be assessed for recoverable information and unresolved responses, provided the relevant experimental context is available. The objective is to focus confirmation work on the cases with a defensible basis for follow-up.
The demonstration provides a starting point for the discussion. A specific assay is evaluated using representative data, controls and the evidence needed to assess response detection, false calls and scientific usefulness. The deliverable is agreed around that evaluation.
PLATEX IN PRACTICE
These anonymized projects show a small selection of the assay and data challenges PlateX can address. Each links the scientific investigation to the decision it enabled.
Adaptive correction helped restore consistent control observations and stable calibration responses in a multi-peak assay.
Adaptive denoising and model-informed reconstruction enabled separate waveform and event-statistics comparisons across drug concentrations.
A fragmented archive became usable for comparison through dynamic plate mapping, adaptive denoising and specialized event analysis.
Cellular waveform assessment supported concentration-dependent APD and repolarization analysis, alongside separate hERG evidence, to guide further research.
Statistical denoising helped recover event information from very low signal-to-noise recordings to inform drug-candidate follow-up.
START A PLATEX DISCUSSION
Tell us about your plate workflow, the difficult readout and the result your team needs. We can discuss the analytical scope and the right form of system delivery.